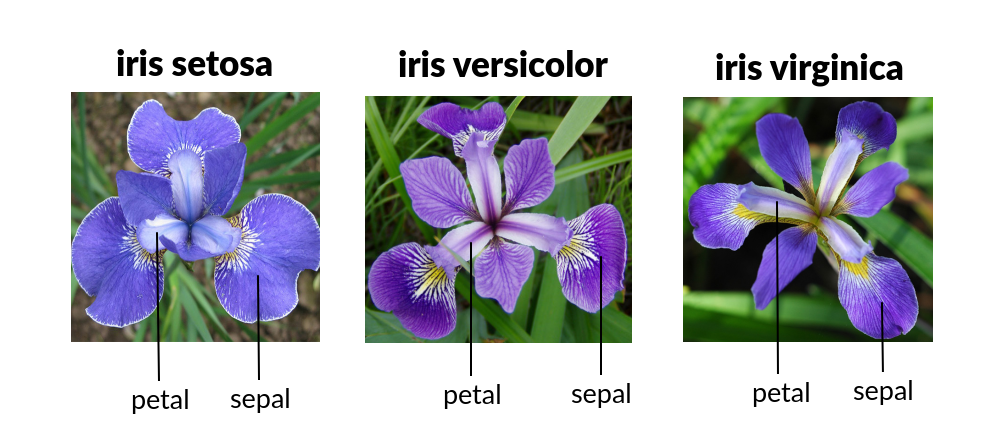
Description: This machine learning model classifies iris flowers into three species, leveraging data preprocessing, feature engineering, and classification techniques. The model's performance was evaluated using various algorithms including logistic regression, decision tree, k-nearest neighbour, and support vector machine (SVM). Additionally, pairplot visualization was used to gain insights into the dataset. The pipeline approach ensured a streamlined workflow, from data preprocessing to classification, enabling accurate predictions of iris species.Our machine learning model classifies iris flowers into three species, leveraging data preprocessing, feature engineering, and classification techniques. The model's performance was evaluated using various algorithms including logistic regression, decision tree, k-nearest neighbour, and support vector machine (SVM). Additionally, pairplot visualization was used to gain insights into the dataset. The pipeline approach ensured a streamlined workflow, from data preprocessing to classification, enabling accurate predictions of iris species.
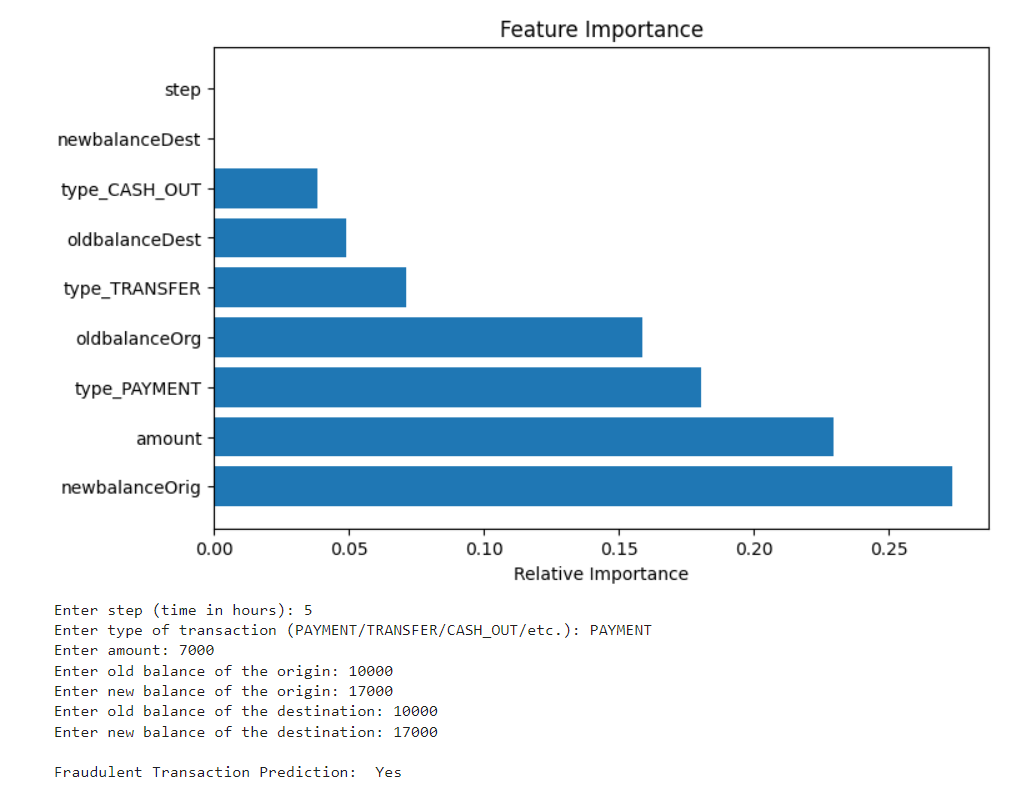
Description: This machine learning model is designed to predict the likelihood of a transaction being fraudulent, utilizing a combination of data preprocessing, feature engineering, and classification techniques. The model's performance was evaluated using metrics such as ROC-AUC, precision, recall, and F1 score, following a train-test split of the dataset. The model was trained on a curated dataset, with data preprocessing steps including handling missing values, feature scaling, and encoding categorical variables. The classification task was implemented using a pipeline approach, ensuring a streamlined and efficient workflow.Our machine learning model is designed to predict the likelihood of a transaction being fraudulent, utilizing a combination of data preprocessing, feature engineering, and classification techniques. The model's performance was evaluated using metrics such as ROC-AUC, precision, recall, and F1 score, following a train-test split of the dataset. The model was trained on a curated dataset, with data preprocessing steps including handling missing values, feature scaling, and encoding categorical variables. The classification task was implemented using a pipeline approach, ensuring a streamlined and efficient workflow.
Description: This Tic-Tac-Toe project is a simple game built using React. The game allows two players to take turns selecting squares on a 3x3 grid, with one player as "X" and the other as "O." The game includes validations for determining a winner, a draw, and managing the game's start and end states. The interface dynamically updates the player's turn, shows the result when a winner is found, and provides an option to restart the game if it ends in a win or a draw. The project demonstrates basic React state management, user interaction, and simple UI design.
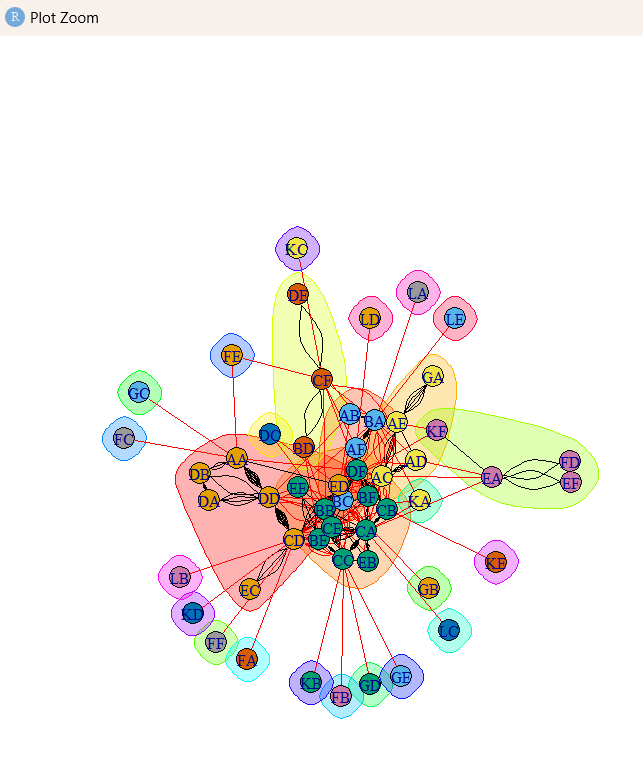
Description:This Social Network Analysis project in R utilizes multiple libraries like igraph, network, sna, and visNetwork to analyze the relationships between entities (nodes) in a network. The project starts by installing these packages and loading the igraph library, which serves as the core tool for constructing and analyzing network graphs. The network graphs are created using the graph() function, which connects vertices (nodes) with edges (links). Various types of networks are explored, including simple graphs and undirected graphs.
The visual representation of these graphs is enhanced using customization features, allowing for color changes to vertices and edges, size adjustments, and layout manipulation. The project moves from a simple network of numerical nodes to a named network of entities (e.g., "Simon", "Josh", etc.), displaying their interconnections in visual plots. Additionally, centrality measures such as degree, closeness, betweenness, and edge betweenness are calculated, helping to identify the most important or influential nodes in the network. For example, degree(g1) gives the number of connections each node has, and betweenness(g1) identifies the nodes that frequently appear on the shortest paths between other nodes.
The project also includes a real-world application where CSV data is imported to form a network graph using the graph.data.frame() function. Node degrees are visualized in histograms, highlighting the distribution of connections across the network. More advanced concepts like hubs and authorities are explored using hub_score() and authority_score(), respectively, demonstrating the influential players in the network.
Finally, community detection techniques such as edge betweenness clustering are applied to identify groups of nodes that are more tightly connected to each other than to the rest of the network. This is illustrated through visual plots, enabling a clearer understanding of the social structures within the dataset. Overall, the project provides a comprehensive approach to analyzing and visualizing social networks, with applications in fields like sociology, biology, and online networks.